<?xml version="1.0" encoding="utf-8"?>
<feed xmlns="http://www.w3.org/2005/Atom">
    <title>ZeroBrane</title>
    <link rel="alternate" type="text/html" href="https://notebook.kulchenko.com/" />
    <link rel="self" type="application/atom+xml" href="https://notebook.kulchenko.com/atom.xml" />
    <id>tag:notebook.kulchenko.com,2009-04-10://2</id>
    <updated>2022-08-23T18:41:31Z</updated>
    <subtitle>By seeking, you will discover...</subtitle>
    <generator uri="http://www.sixapart.com/movabletype/">Movable Type Pro 4.38</generator>

<entry>
    <title>Redbean web server debugging with ZeroBrane Studio</title>
    <link rel="alternate" type="text/html" href="https://notebook.kulchenko.com/redbean/redbean-debugging-with-zerobrane-studio" />
    <id>tag:notebook.kulchenko.com,2022://2.192</id>

    <published>2022-08-11T03:46:16Z</published>
    <updated>2022-08-23T18:41:31Z</updated>

    <summary>Redbean is a single file web server that runs on Linux, Windows, macOS and several other platforms and embeds Lua, SQLite, and a host of other useful components that are all available from Lua code. ZeroBrane Studio relies on Mobdebug...</summary>
    <author>
        <name>Paul Kulchenko</name>
        
    </author>
    
        <category term="redbean" scheme="http://www.sixapart.com/ns/types#category" />
    
        <category term="zerobrane" scheme="http://www.sixapart.com/ns/types#category" />
    
    <category term="redbean" label="redbean" scheme="http://www.sixapart.com/ns/types#tag" />
    <category term="zerobrane" label="zerobrane" scheme="http://www.sixapart.com/ns/types#tag" />
    
    <content type="html" xml:lang="en" xml:base="https://notebook.kulchenko.com/">
        <![CDATA[<p><a href="https://redbean.dev/">Redbean</a> is a single file web server that runs on Linux, Windows, macOS and several other platforms and embeds Lua, <span class="caps">SQL</span>ite, and a host of other useful components that are all available from Lua code. <a href="https://studio.zerobrane.com">ZeroBrane Studio</a> relies on <a href="https://github.com/pkulchenko/MobDebug">Mobdebug</a> for its debugging capabilities, which in turn requires luasocket, but redbean compiles all its components statically and doesn't yet support dynamic linking, so using luasocket wasn't an option. Fortunately, <a href="https://justine.lol/">the author of redbean</a> implemented a powerful <a href="https://redbean.dev/#unix"><span class="caps">UNIX </span>module</a>, which includes raw socket support, among other things. This was enough to implement a <a href="https://github.com/pkulchenko/ZeroBranePackage/blob/master/redbean.lua#L95-L132">tiny Lua library</a> that provides just enough methods to trick Mobdebug into thinking that it has luasocket available.</p>

<p><img src="/images/zerobrane-studio-redbean-debugging-0.png" alt="Redbean debugging"/></p>

<p>The redbean plugin that implements this integration is <a href="https://github.com/pkulchenko/ZeroBranePackage/blob/master/redbean.lua">available in the plugin repository</a>. Let's see how you can debug a Redbean script using this plugin.</p>]]>
        <![CDATA[<h2>ZeroBrane Studio configuration.</h2>

<p>1. Get <a href="http://studio.zerobrane.com">ZeroBrane Studio</a> (1.60+). These instructions are for Windows, but the debugging should (and have been confirmed to) work on Linux and macOS as well.</p>

<p>2. Get <a href="https://github.com/pkulchenko/ZeroBranePackage/blob/master/redbean.lua">redbean plugin</a> and save it to <code>HOME/.zbstudio/packages/</code> or <code>ZBS/packages/</code> folder (where <code>ZBS</code> is the path to ZeroBrane Studio location and <code>HOME</code> is the path specified by the <code>HOME</code> environment variable); the first option may also be preferable for Mac OS X users as the packages/ folder may be overwritten during an application upgrade.</p>

<p>3. If you have redbean.com executable in your project folder or in one of the folders listed in the <code>PATH</code> environment variable, you can skip this step; if not, you can open ZeroBrane Studio config file (<code>Edit | Preferences | Settings: User</code>) and set <code>path.redbean</code> value pointing to the location of redbean.com executable. You'll need to restart the <span class="caps">IDE </span>for the configuration changes to have effect.</p>

<p>4. Start ZeroBrane Studio (<code>zbstudio.exe</code> or <code>zbstudio.sh</code>).</p>

<h2>Script debugging.</h2>

<p>Let's debug a simple Redbean script:</p>

<pre><code>if MDB then MDB.on() end -- only needed when debugging .init.lua code
print(&quot;Hello from ZeroBrane Studio&quot;)
local a = 1
print(&quot;Hello from Redbean&quot;, a)
-- OnHttpRequest is executed on each request
function OnHttpRequest()
  local url = GetUrl()
  Write(&quot;inside request: &quot; .. url)
end</code></pre>

<p>Save it as <code>.init.lua</code>, set the project directory to the folder where you saved the script (<code>Project | Project Directory | Set From Current File</code>) and <b>select Redbean as the current interpreter</b> by going to <code>Project | Lua Interpreter | Redbean</code> (this option is only available when you have Redbean plugin already installed).</p>

<p>The last step is to add <code>.init.lua</code> file to your <code>redbean.com</code> file. If you are on Linux or macOS, you can use <code>redbean.com -A .init.lua</code> command. If you're on Windows, use <a href="https://redbean.dev/zip.com">zip.com</a> archiver to add <code>.init.lua</code> to <code>redbean.com</code>.</p>

<p>Now if you <code>Run</code> the script, you should see the following output:</p>

<pre><code>Hello from ZeroBrane Studio
Hello from Redbean	1
I2022-08-10T21:01:21.214333:tool/net/redbean.c:7067:redbean:10816] (srvr) listen http://192.168.1.8:8080
I2022-08-10T21:01:21+000000:tool/net/redbean.c:7067:redbean:10816] (srvr) listen http://127.0.0.1:8080</code></pre>

<p>The first two lines came from the two <code>print</code> calls in <code>.init.lua</code> and the last two are the log messages from redbean.</p>

<p>There are a couple of things worth mentioning: the first line with a check for <code>MDB</code> enables debugging of <code>.init.lua</code> code itself; the <code>MDB</code> value is only set when debugging is requested from the <span class="caps">IDE, </span>so it can be left in, as the script will be executed correctly outside of the <span class="caps">IDE </span>as well.</p>

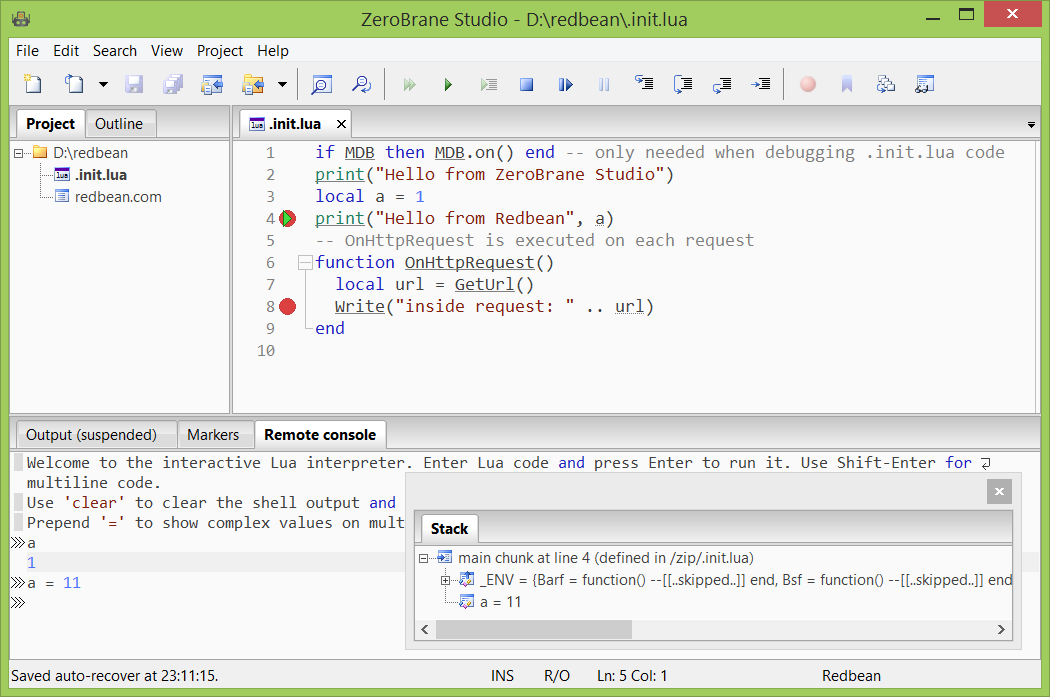
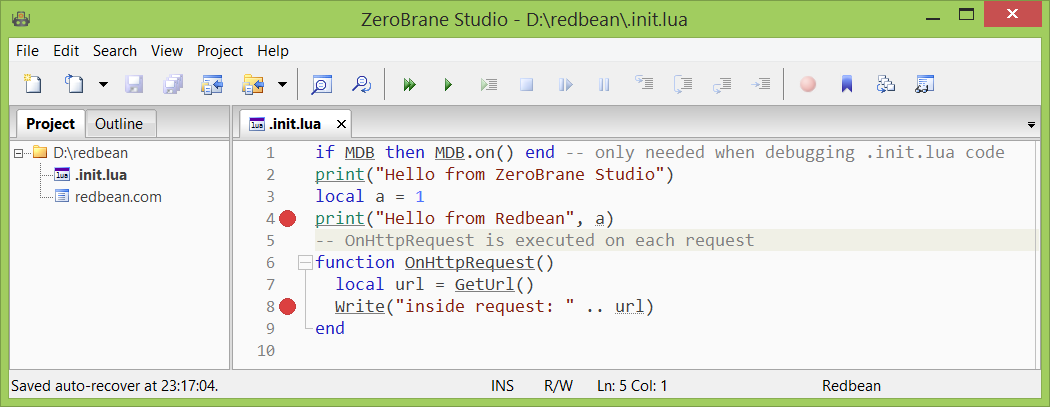
<p>If you set a breakpoint on line 4 and select <code>Debug</code>, you should see the debugging started and suspended at line 4:</p>

<p><img src="/images/zerobrane-studio-redbean-debugging-1.png" alt="Redbean debugging"/></p>

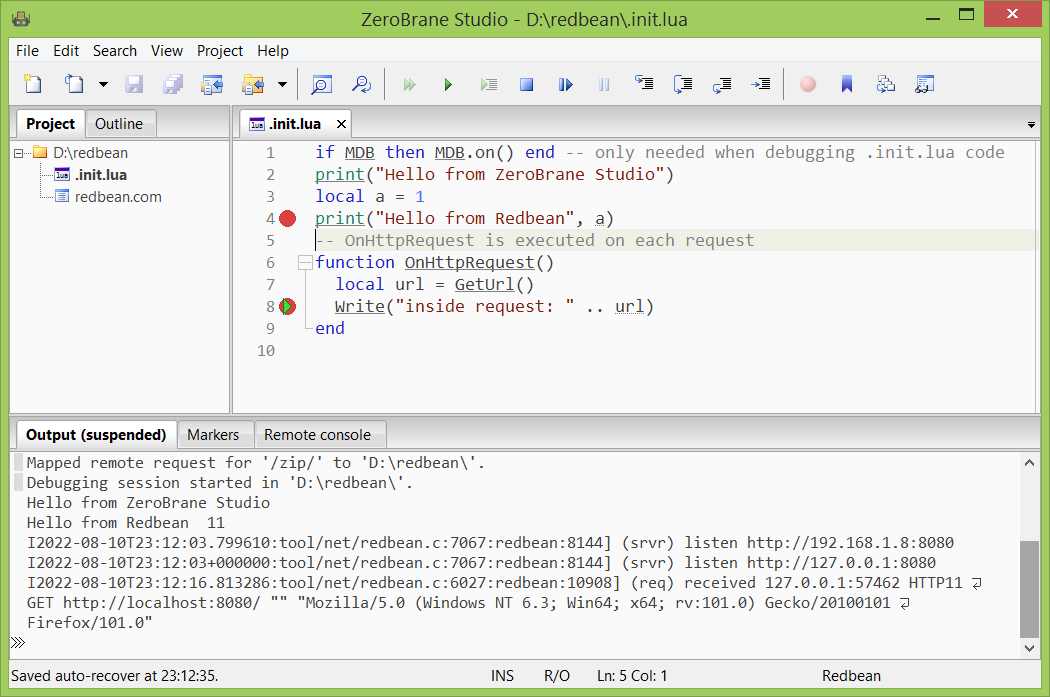
<p>You should now be able to step through the script, look at the stack trace, and use all other debugging functionality available in ZeroBrane Studio. For example, you can use the Remote console tab to get the value of local variable and change them (as shown in the screenshot). If you continue the execution of the script (using Run) or step through the next line (using Step), you should see "Hello from Redbean 11" printed:</p>

<p><img src="/images/zerobrane-studio-redbean-debugging-2.png" alt="More Redbean debugging"/></p>

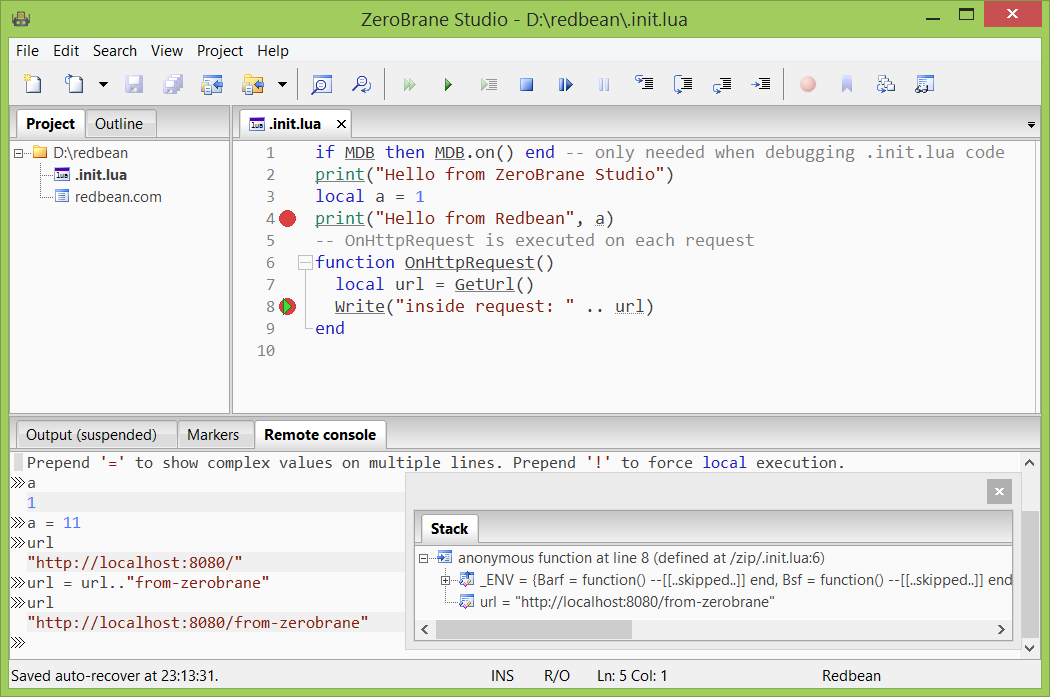
<p>You can also set breakpoints inside the <code>OnHttpRequest</code> function, so if you set a breakpoint on line 8, execute Run and point your browser to http://localhost:8080/, you should see the execution stopped on that breakpoint (and the Output updated with a new log message from the request). You can now inspect the value of any script variable and run any other Redbean commands (like <code>GetHeader</code>, <code>SetHeader</code> and others). Every command executed in the Remote console tab is executed in the context of the actual redbean process, so if you modify the value the <code>url</code> variable (as shown in the next screenshot) and continue execution, you should see the result in the browser with the modified value:</p>

<p><img src="/images/zerobrane-studio-redbean-debugging-3.png" alt="More Redbean debugging with modified output"/></p>

<p>When you're done with debugging, you can either stop the process using <code>Project | Stop</code> menu (which will stop redbean instance if it's running on the same computer) or detach the redbean process using <code>Project | Detach</code> (which will continue running the current process, but without debugging).</p>]]>
    </content>
</entry>

<entry>
    <title>GMaps: Canvas overlays with colors</title>
    <link rel="alternate" type="text/html" href="https://notebook.kulchenko.com/maps/gmaps-canvas-overlays-with-colors" />
    <id>tag:notebook.kulchenko.com,2017://2.191</id>

    <published>2017-01-03T02:56:33Z</published>
    <updated>2017-08-18T07:24:44Z</updated>

    <summary>Back in 2009 I made several small GoogleMaps-based projects to show drawing on top of maps using canvas tiles. Till this day I continue getting emails with questions about some of those projects, and one of the frequent requests was...</summary>
    <author>
        <name>Paul Kulchenko</name>
        
    </author>
    
        <category term="maps" scheme="http://www.sixapart.com/ns/types#category" />
    
    <category term="api" label="api" scheme="http://www.sixapart.com/ns/types#tag" />
    <category term="example" label="example" scheme="http://www.sixapart.com/ns/types#tag" />
    <category term="maps" label="maps" scheme="http://www.sixapart.com/ns/types#tag" />
    <category term="tutorial" label="tutorial" scheme="http://www.sixapart.com/ns/types#tag" />
    
    <content type="html" xml:lang="en" xml:base="https://notebook.kulchenko.com/">
        <![CDATA[<p><a href="/maps/">Back in 2009</a> I made several small GoogleMaps-based projects to show drawing on top of maps using canvas tiles. Till this day I continue getting emails with questions about some of those projects, and one of the frequent requests was whether it's possible to extend the markers to use multiple colors.</p>

<p>You can find the code for the "original" map with 400 markers using the same color <a href="/maps/gridmark">here</a>. This map shows the markers and allows the user to mouseover them with the cursor changing its shape when passing over a marker. A slightly different mechanism is shown <a href="/maps/datamark">here</a>, which generates real markers, but only for those tiles that are currently displayed (to limit the number of markers displayed); the demo doesn't fully work for v2 <span class="caps">API </span>as it seems like isHidden method has changed its behavior.</p>

<p>The modified map with 400 markers using <b>multiple colors</b> is available <a href="/maps/gridcolr">here</a>. It assigns one of two colors randomly, but you can use a similar mechanism to pick the color you need based on some marker data.</p>]]>
        
    </content>
</entry>

<entry>
    <title>Torch debugging with ZeroBrane Studio</title>
    <link rel="alternate" type="text/html" href="https://notebook.kulchenko.com/zerobrane/torch-debugging-with-zerobrane-studio" />
    <id>tag:notebook.kulchenko.com,2016://2.190</id>

    <published>2016-01-14T21:40:00Z</published>
    <updated>2022-08-11T21:57:45Z</updated>

    <summary>Torch is a powerful computing framework that includes various machine learning algorithms and is built on LuaJIT, so it looked like a natural fit for support in ZeroBrane Studio. Soumith Chintala already did bulk of the work with ZeroBrane Studio...</summary>
    <author>
        <name>Paul Kulchenko</name>
        
    </author>
    
        <category term="zerobrane" scheme="http://www.sixapart.com/ns/types#category" />
    
    <category term="ide" label="ide" scheme="http://www.sixapart.com/ns/types#tag" />
    <category term="torch" label="torch" scheme="http://www.sixapart.com/ns/types#tag" />
    <category term="zerobrane" label="zerobrane" scheme="http://www.sixapart.com/ns/types#tag" />
    
    <content type="html" xml:lang="en" xml:base="https://notebook.kulchenko.com/">
        <![CDATA[<p><a href="http://torch.ch/">Torch</a> is a powerful computing framework that includes various machine learning algorithms and is built on LuaJIT, so it looked like a natural fit for support in ZeroBrane Studio. <a href="https://github.com/soumith">Soumith Chintala</a> already did bulk of the work with <a href="https://github.com/soumith/zbs-torch">ZeroBrane Studio clone that included Torch7 interpreter</a> with debugging support, but it required some core changes, so it couldn't be easily combined with ZeroBrane Studio.</p>

<p>As the plugin <span class="caps">API </span>was extended with new functions in the most recent versions of the <span class="caps">IDE, </span>it  became possible to implement the integration with Torch as a plugin, which is now <a href="https://github.com/pkulchenko/ZeroBranePackage/blob/master/torch7.lua">available in the plugin repository</a>.</p>

<p>Let's see how you can debug a Torch script or an application using this plugin.</p>

<h2>ZeroBrane Studio configuration.</h2>

<p>1. Get <a href="http://studio.zerobrane.com">ZeroBrane Studio</a> (1.10+). These instructions are for Windows, but the debugging should work on Linux and <span class="caps">OSX </span>as well.</p>

<p>2. Get <a href="https://github.com/pkulchenko/ZeroBranePackage/blob/master/torch7.lua">torch plugin</a> and save it to <code>HOME/.zbstudio/packages/</code> or <code>ZBS/packages/</code> folder (where <code>ZBS</code> is the path to ZeroBrane Studio location and <code>HOME</code> is the path specified by the <code>HOME</code> environment variable); the first option may also be preferable for Mac OS X users as the packages/ folder may be overwritten during an application upgrade.</p>

<p>3. If you have <code>TORCH_BIN</code> environment variable defined, you can skip this step; if not, you can open ZeroBrane Studio config file (<code>Edit | Preferences | Settings: User</code>) and set <code>path.torch</code> value pointing to the th executable or the directory with the torch library (<code>libtorch</code>);for example, <code>path.torch = [[D:/torch7/]]</code>. You'll need to restart the <span class="caps">IDE </span>for the configuration changes to have effect.</p>

<p>4. Start ZeroBrane Studio (<code>zbstudio.exe</code> or <code>zbstudio.sh</code>).</p>

<h2>Script debugging.</h2>

<p>We can now debug a simple Torch script:</p>

<pre><code>local torch = require 'torch'
local data = torch.Tensor{
  {68, 24, 20},
  {74, 26, 21},
  {80, 32, 24},
}
print(data)</code></pre>

<p>Save it as <code>test.lua</code> and set the project directory to the folder where you saved the script (<code>Project | Project Directory | Set From Current File</code>) and <b>select Torch as the current interpreter</b> by going to <code>Project | Lua Interpreter | Torch-7</code> (this option is only available when the Torch plugin is installed).</p>

<p>Now if you <code>Run</code> the script, you should see the following output:</p>

<pre><code> 68  24  20
 74  26  21
 80  32  24
[torch.DoubleTensor of size 3x3]</code></pre>

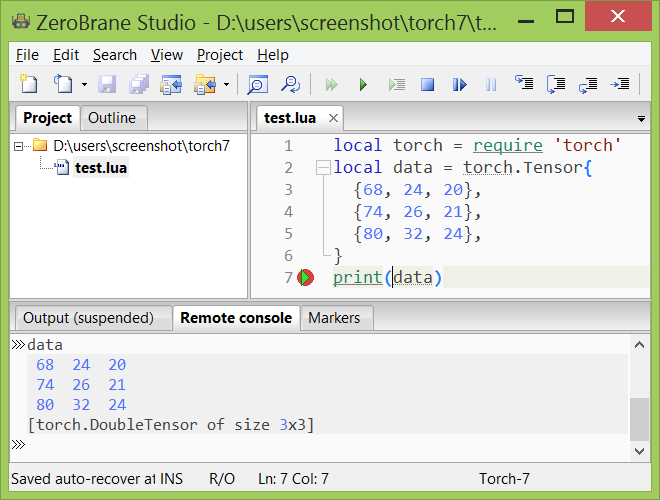
<p>If you select <code>Debug</code>, you should see the debugging started at line 1 and should be able to step through the script, set breakpoints, look at the stack trace, and use all other debugging functionality available in ZeroBrane Studio. If you set a breakpoint on line 7 and run to that line, you should see something similar to the following screenshot:</p>

<p><img src="/images/zerobrane-studio-torch7-debugging.png" alt="Torch7 debugging"/></p>

<p>For those of you familiar with <span class="caps">ZBS</span>-torch, the plugin provides similar functionality, but implements visualization of Torch elements in a way similar to how it's done in Torch <span class="caps">REPL </span>and also removes backspaces in Torch output that is shown in the Output window.</p>]]>
        
    </content>
</entry>

<entry>
    <title>Installation complete. You may need to rest...</title>
    <link rel="alternate" type="text/html" href="https://notebook.kulchenko.com/programming/installation-complete-you-may-need-to-rest" />
    <id>tag:notebook.kulchenko.com,2016://2.189</id>

    <published>2016-01-13T21:31:24Z</published>
    <updated>2016-01-15T03:27:48Z</updated>

    <summary>Found this gem in my archives. This is the snapshot I took about 6 months ago after one of the Adobe Flash installs. It&apos;s interesting that the next version didn&apos;t have this glitch....</summary>
    <author>
        <name>Paul Kulchenko</name>
        
    </author>
    
        <category term="programming" scheme="http://www.sixapart.com/ns/types#category" />
    
    
    <content type="html" xml:lang="en" xml:base="https://notebook.kulchenko.com/">
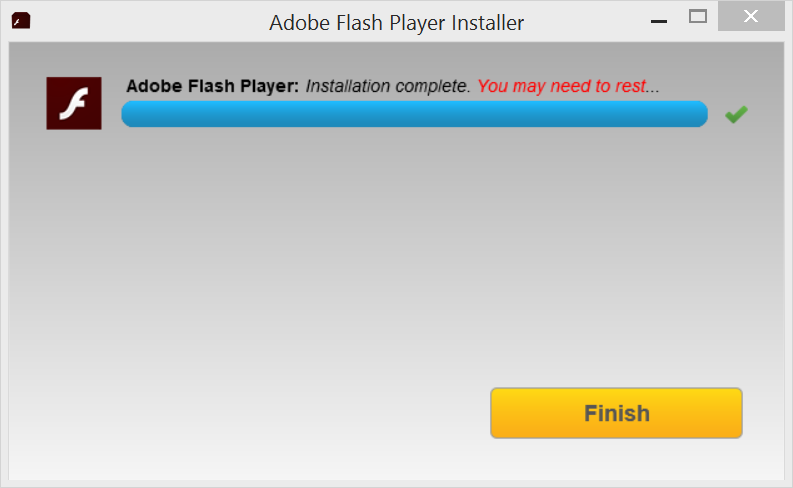
        <![CDATA[<p>Found this gem in my archives. This is the snapshot I took about 6 months ago after one of the Adobe Flash installs. It's interesting that the next version didn't have this glitch.</p>

<p><img src="/images/installation-complete-you-may-need-to-rest.png" alt="Installation Complete. You may need to rest..."/></p>]]>
        
    </content>
</entry>

<entry>
    <title>Redis Lua debugging with ZeroBrane Studio</title>
    <link rel="alternate" type="text/html" href="https://notebook.kulchenko.com/zerobrane/redis-lua-debugging-with-zerobrane-studio" />
    <id>tag:notebook.kulchenko.com,2016://2.188</id>

    <published>2016-01-05T21:49:13Z</published>
    <updated>2016-01-14T21:38:14Z</updated>

    <summary>Redis is a popular open-source in-memory datastore that provides Lua scripting among its other interesting features. When I first looked into getting the debugging of Redis Lua scripts to work with ZeroBrane Studio, I wasn&apos;t able to accomplish much as...</summary>
    <author>
        <name>Paul Kulchenko</name>
        
    </author>
    
        <category term="zerobrane" scheme="http://www.sixapart.com/ns/types#category" />
    
    <category term="ide" label="ide" scheme="http://www.sixapart.com/ns/types#tag" />
    <category term="zerobrane" label="zerobrane" scheme="http://www.sixapart.com/ns/types#tag" />
    
    <content type="html" xml:lang="en" xml:base="https://notebook.kulchenko.com/">
        <![CDATA[<p><a href="http://redis.io/">Redis</a> is a popular open-source in-memory datastore that provides Lua scripting among its other interesting features. When I first looked into getting the debugging of Redis Lua scripts to work with <a href="http://studio.zerobrane.com">ZeroBrane Studio</a>, I wasn't able to accomplish much as the debugger used in the <span class="caps">IDE </span>relies on the debug library, which is not available from the Redis sandbox that runs Lua scripts. </p>

<p>This has changed when Salvatore Sanfilippo <a href="http://antirez.com/news/97">implemented a debugger</a> for debugging Lua scripts running by Redis. It supports stepping through the script, setting breakpoints, inspect variables, and other functions you'd expect from a debugger. It accepts commands over the same protocol as Redis itself and provides command-line interface to work with.</p>

<p>Availability of this debugger in Redis made possible to create a package in ZeroBrane Studio, that would act as a proxy and forward requests to the debugger, thus enabling full access to debugging features in the <span class="caps">IDE.</span></p>

<p>After being contacted by <a href="https://twitter.com/itamarhaber">Itamar Haber</a> from RedisLabs, we quickly put together a <a href="https://github.com/pkulchenko/ZeroBranePackage/blob/master/redis.lua">plugin for ZeroBrane Studio</a> that you can get from the plugin repository (make sure you use <a href="http://studio.zerobrane.com/">ZeroBrane Studio</a> v1.10 or later).</p>

<p>Itamar also put together a <a href="https://redislabs.com/blog/zerobrane-studio-plugin-for-redis-lua-scripts">post with detailed instructions and a tutorial</a> on how this integration works for debugging Redis Lua scripts with ZeroBrane Studio. Leave a comment or send me an email if you run across an issue with the integration package or have suggestions on what can be improved.</p>]]>
        
    </content>
</entry>

<entry>
    <title>Debugging Mashape Kong plugins with ZeroBrane Studio</title>
    <link rel="alternate" type="text/html" href="https://notebook.kulchenko.com/zerobrane/debugging-mashape-kong-plugins-with-zerobrane-studio" />
    <id>tag:notebook.kulchenko.com,2015://2.187</id>

    <published>2015-12-23T06:12:25Z</published>
    <updated>2016-01-14T21:38:45Z</updated>

    <summary>Mashape Kong is open-source API and microservices management system based on Nginx and written in Lua that also supports Lua plugins. Dietmar Wolz put together a detailed tutorial on how ZeroBrane Studio IDE can be used to debug Kong Lua...</summary>
    <author>
        <name>Paul Kulchenko</name>
        
    </author>
    
        <category term="zerobrane" scheme="http://www.sixapart.com/ns/types#category" />
    
    <category term="ide" label="ide" scheme="http://www.sixapart.com/ns/types#tag" />
    <category term="zerobrane" label="zerobrane" scheme="http://www.sixapart.com/ns/types#tag" />
    
    <content type="html" xml:lang="en" xml:base="https://notebook.kulchenko.com/">
        <![CDATA[<p>Mashape Kong is open-source <span class="caps">API </span>and microservices management system based on Nginx and written in Lua that also supports Lua plugins. Dietmar Wolz put together a <a href="http://lua-programming.blogspot.de/2015/12/how-to-debug-kong-plugins-on-windows.html">detailed tutorial</a> on how <a href="http://studio.zerobrane.com">ZeroBrane Studio <span class="caps">IDE</span></a> can be used to debug Kong Lua plugins.</p>

<p>If you are looking for debugging of Nginx Lua scripts in general, then check <a href="http://notebook.kulchenko.com/zerobrane/debugging-openresty-nginx-lua-scripts-with-zerobrane-studio">this earlier post for details</a>.</p>]]>
        
    </content>
</entry>

<entry>
    <title>ZeroBrane Studio in black</title>
    <link rel="alternate" type="text/html" href="https://notebook.kulchenko.com/zerobrane/zerobrane-studio-in-black" />
    <id>tag:notebook.kulchenko.com,2014://2.186</id>

    <published>2014-07-09T23:53:39Z</published>
    <updated>2017-11-26T20:32:28Z</updated>

    <summary>A screenshot of ZeroBrane Studio in black (Ubuntu 12.04, MATE Desktop with BlackMATE theme, TomorrowNightBright ZBS theme), courtesy of naturally as shown in Moai forums. You may click on the image to see it full screen. You can choose one...</summary>
    <author>
        <name>Paul Kulchenko</name>
        
    </author>
    
        <category term="zerobrane" scheme="http://www.sixapart.com/ns/types#category" />
    
    <category term="ide" label="ide" scheme="http://www.sixapart.com/ns/types#tag" />
    <category term="zerobrane" label="zerobrane" scheme="http://www.sixapart.com/ns/types#tag" />
    
    <content type="html" xml:lang="en" xml:base="https://notebook.kulchenko.com/">
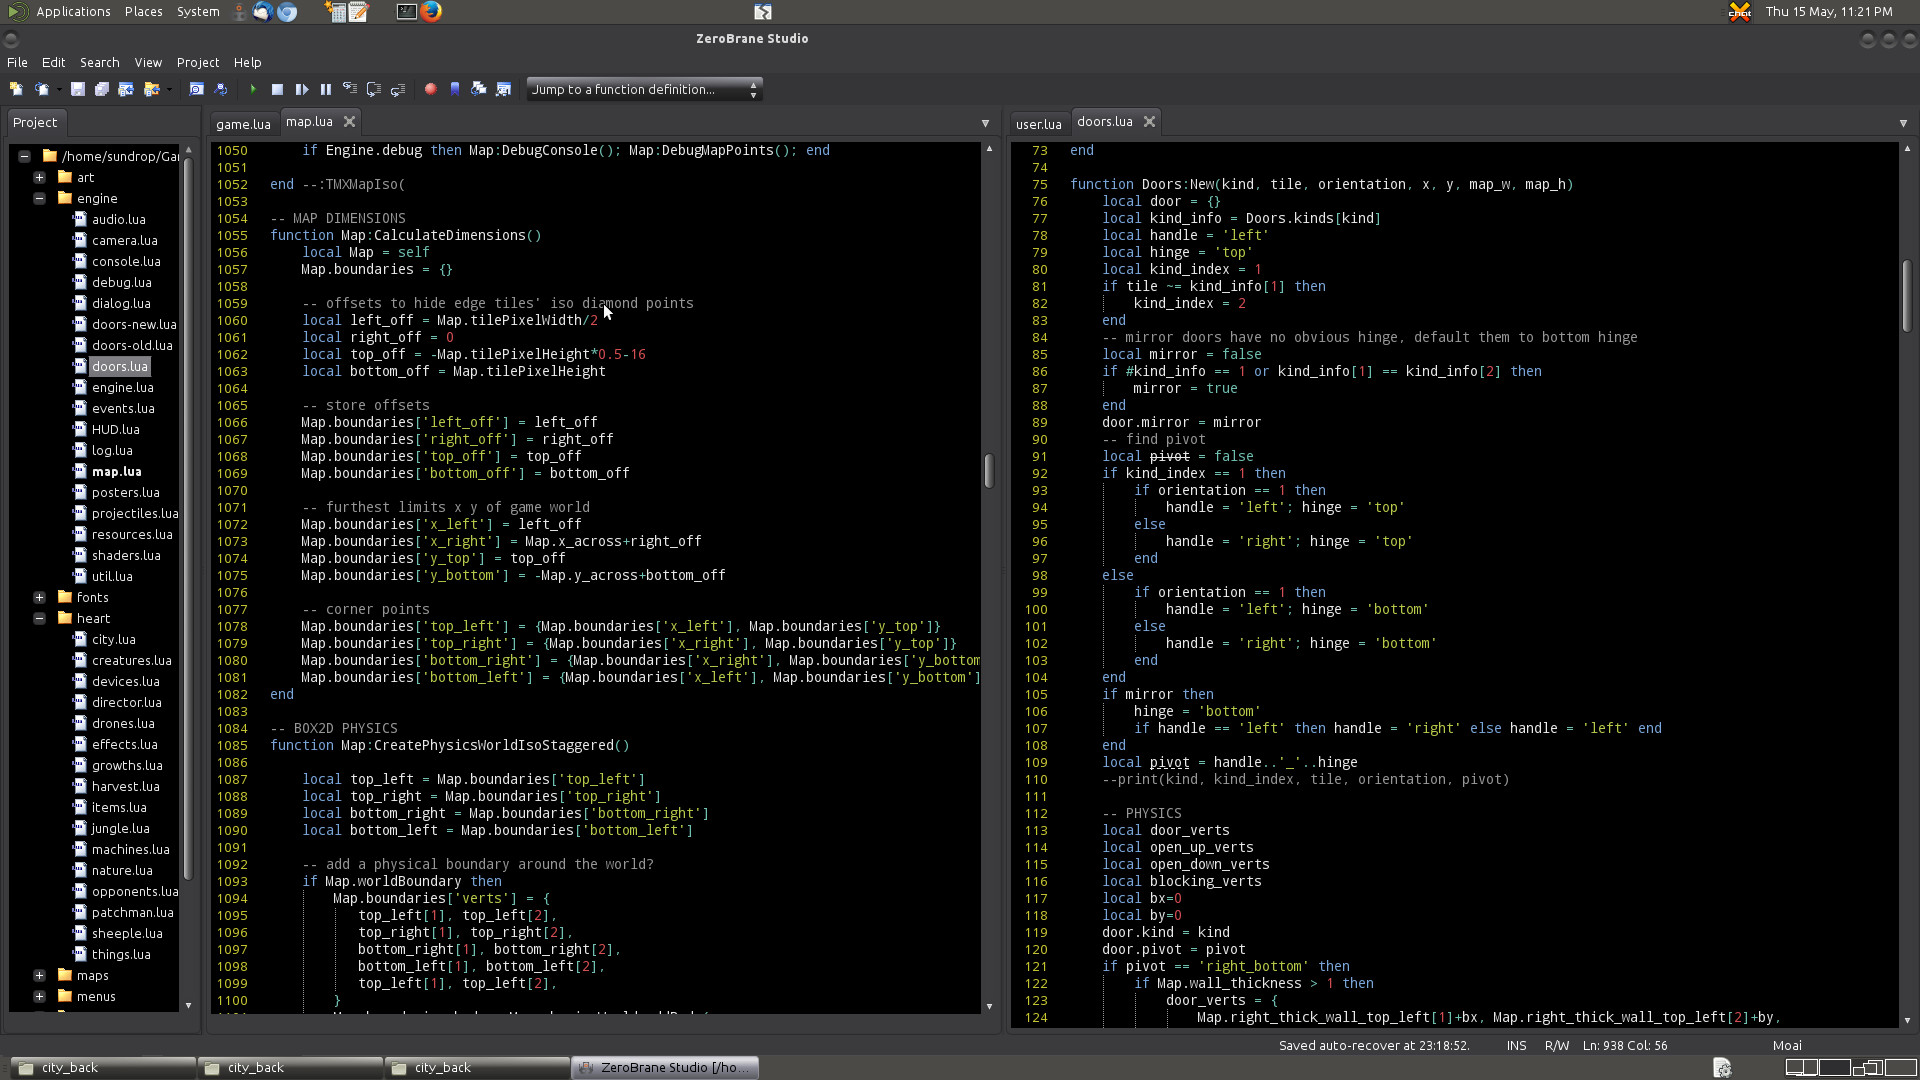
        <![CDATA[<p>A screenshot of ZeroBrane Studio in black (Ubuntu 12.04, <span class="caps">MATE</span> Desktop with BlackMATE theme, TomorrowNightBright <span class="caps">ZBS </span>theme), courtesy of <a href="http://www.naturallyintelligent.com/">naturally</a> as shown in <a href="http://getmoai.com/forums/post14460.html">Moai forums</a>. You may click on the image to see it full screen.</p>

<p><a href="/images/zerobrane-studio-in-black.png"><img src="/images/zerobrane-studio-in-black.png" /></a></p>

<p>You can choose one from <a href="/zerobrane/zerobrane-studio-in-zenburn-and-tomorrow-colors">several color themes</a> that are included with ZeroBrane Studio.</p>]]>
        
    </content>
</entry>

<entry>
    <title>Moonscript debugging with ZeroBrane Studio</title>
    <link rel="alternate" type="text/html" href="https://notebook.kulchenko.com/zerobrane/moonscript-debugging-with-zerobrane-studio" />
    <id>tag:notebook.kulchenko.com,2014://2.184</id>

    <published>2014-06-22T04:21:26Z</published>
    <updated>2014-06-22T05:08:14Z</updated>

    <summary>Moonscript is an interesting dynamic scripting language that compiles to Lua. Moonscript can be dynamically compiled and run using a component called moonloader and because moonloader keeps a mapping between the moonscript code and the produced Lua code, I thought...</summary>
    <author>
        <name>Paul Kulchenko</name>
        
    </author>
    
        <category term="zerobrane" scheme="http://www.sixapart.com/ns/types#category" />
    
    <category term="ide" label="ide" scheme="http://www.sixapart.com/ns/types#tag" />
    <category term="lua" label="lua" scheme="http://www.sixapart.com/ns/types#tag" />
    <category term="moonscript" label="moonscript" scheme="http://www.sixapart.com/ns/types#tag" />
    <category term="zerobrane" label="zerobrane" scheme="http://www.sixapart.com/ns/types#tag" />
    
    <content type="html" xml:lang="en" xml:base="https://notebook.kulchenko.com/">
        <![CDATA[<p><a href="http://moonscript.org/">Moonscript</a> is an interesting <b>dynamic scripting language that compiles to Lua</b>. Moonscript can be dynamically compiled and run using a component called <em>moonloader</em> and because moonloader keeps a mapping between the moonscript code and the produced Lua code, I thought it could be possible to extend the debugging in <a href="http://studio.zerobrane.com">ZeroBrane Studio</a> to take that mapping into account in some way.</p>

<p>The version of the debugging bundled with ZeroBrane Studio v0.70+ provides a way to specify a line mapper that can be used to map the current line in the Lua code to the line number in the "original" moonscript code. This code is "injected" in the debugger when the debugging session is started, so any line number used by the debugger (whether to show the current line, set a breakpoint, or display a stack trace) goes through that mapping.</p>

<p>Let's see how you can now <b>debug moonscript files</b>.</p>

<h2>ZeroBrane Studio configuration.</h2>

<p>1. Get <a href="http://studio.zerobrane.com">ZeroBrane Studio</a> (0.70+). These instructions are for Windows, but the debugging should work on Linux and <span class="caps">OSX </span>as well.</p>

<p>2. Get <a href="https://github.com/pkulchenko/ZeroBranePackage/blob/master/moonscript.lua">Moonscript plugin</a> and save it to <code>ZBS/packages/</code> or <code>HOME/.zbstudio/packages</code> folder (where <code>ZBS</code> is the path to ZeroBrane Studio location and <code>HOME</code> is the path specified by the <code>HOME</code> environment variable); the second option may also be preferable for Mac OS X users as the packages/ folder may be overwritten during an application upgrade.</p>

<p>3. (Optional) If <code>moon</code> executable is in a folder listed in the <span class="caps">PATH </span>environment variable, you don't need to do anything as the plugin will find it; if the executable is in some other location, you may need to add <code>path.moonscript = [[/full/path/moon.exe]]</code> to the <span class="caps">ZBS </span>configuration file (<code>Edit | Preferences | Settings: User</code>).</p>

<p>4. Start <span class="caps">ZBS </span>(<code>zbstudio.exe</code> or <code>zbstudio.sh</code>).</p>

<h2>Script debugging.</h2>

<p>Let's now debug a simple three line script:</p>

<pre><code>sum = (x, y) -&gt;
  x + y
print &quot;The sum is &quot;, sum 10, 20</code></pre>

<p>Save it as <code>sum.moon</code> and set the project directory to the folder where you saved the script (<code>Project | Project Directory | Set From Current File</code>) and <b>select Moonscript as the current interpreter</b> by going to <code>Project | Lua Interpreter | Moonscript</code> (this option is only available when the Moonscript plugin is installed).</p>

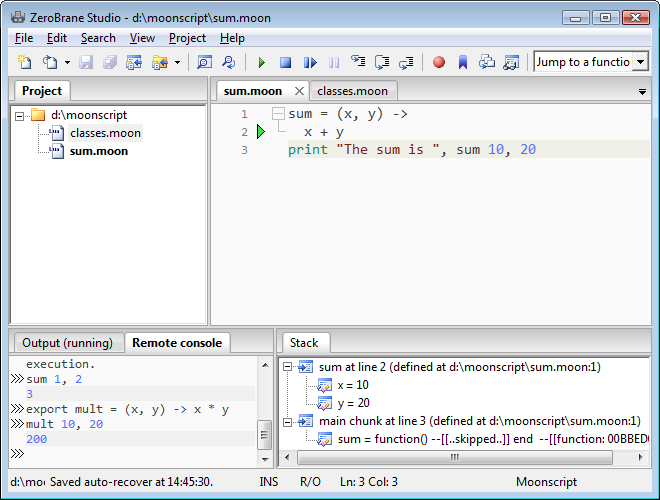
<p>Now if you <code>Run</code> the script, you should see "The sum is 30" in the output. If you select <code>Debug</code>, you should see the debugging started at line 1 and should be able to step through the script, set breakpoints, look at the stack trace, and use all other debugging functionality available in ZeroBrane Studio. Note that all the line numbers are from the moonscript source and not from the (dynamically) generated Lua code, as can be seen on the screenshot:</p>

<p><img src="/images/zerobrane-studio-moonscript-debugging.png" alt="Moonscript debugging"/></p>

<p>You may notice that stepping in the debugger through the moonscript code spends more time on the same line than you'd expect. One of the most prominent examples is class definitions or table comprehensions that map few lines of Moonscript code to a (potentially) large number of lines in the corresponding Lua code, which causes the debugger to stay on the same line for each "step" through the Lua code. This may be improved in the future, but for now it's something to keep in mind; if you want to get to your destination faster, you can use breakpoints.</p>

<p>That's not all you can use the debugger for. You can also <b>use moonscript expressions in the Watch panel</b>; for example, if you enter <code>sum 10, 20</code>, you'll see 30 as the result after <code>sum</code> function is defined.</p>

<p>But there is more. You can also <b>execute moonscript expressions in the Remote console</b>. As can be seen on the screenshot, you can execute <code>sum 1, 2</code> and get 3 as the result. You can also execute <code>export mult = (x, y) -&gt; x * y</code> and then execute <code>mult 10, 20</code> to get 200 as the result. Essentially, you can use the Remote console as Moonscript <span class="caps">REPL </span>with access to your application state. The only current limitation with the console commands is that they need to be single commands; this is a feature of command execution in the console that "flattens" multi-line scripts into one-liners (which doesn't work well with Moonscript, because of its whitespace sensitivity).</p>

<p>And one more thing.  Not only syntax highlighting and folding is supported to some degree (as it's based on the Coffeescript lexer), but <b>auto-complete for Lua functions</b> also works with both . and \ notations, so using <code>str = &quot;&quot;</code> and <code>str\</code> will offer "string" methods in the auto-complete list.</p>

<p>This functionality is highly experimental and has been tested with Moonscript 0.2.5 and 0.2.6 using the current ZeroBrane Studio (0.70). Give it a try with your moonscript application and share your experience in the comments or using any <a href="http://studio.zerobrane.com/community.html">other method that works for you</a>.</p>]]>
        
    </content>
</entry>

<entry>
    <title>Lapis debugging with ZeroBrane Studio</title>
    <link rel="alternate" type="text/html" href="https://notebook.kulchenko.com/zerobrane/lapis-debugging-with-zerobrane-studio" />
    <id>tag:notebook.kulchenko.com,2014://2.185</id>

    <published>2014-06-18T04:28:11Z</published>
    <updated>2014-06-19T04:57:22Z</updated>

    <summary>Fresh on the heels of getting OpenResty debugging to work with ZeroBrane Studio, I thought I would take a look at Lapis debugging. Lapis is a web framework for Lua or Moonscript, which runs inside OpenResty. Leaf Corcoran just released...</summary>
    <author>
        <name>Paul Kulchenko</name>
        
    </author>
    
        <category term="zerobrane" scheme="http://www.sixapart.com/ns/types#category" />
    
    <category term="ide" label="ide" scheme="http://www.sixapart.com/ns/types#tag" />
    <category term="lapis" label="lapis" scheme="http://www.sixapart.com/ns/types#tag" />
    <category term="lua" label="lua" scheme="http://www.sixapart.com/ns/types#tag" />
    <category term="zerobrane" label="zerobrane" scheme="http://www.sixapart.com/ns/types#tag" />
    
    <content type="html" xml:lang="en" xml:base="https://notebook.kulchenko.com/">
        <![CDATA[<p>Fresh on the heels of getting <a href="http://notebook.kulchenko.com/zerobrane/debugging-openresty-nginx-lua-scripts-with-zerobrane-studio">OpenResty debugging</a> to work with <a href="http://studio.zerobrane.com">ZeroBrane Studio</a>, I thought I would take a look at <b>Lapis debugging</b>. Lapis is a <a href="http://leafo.net/lapis/">web framework for Lua or Moonscript</a>, which runs inside OpenResty. <a href="https://twitter.com/moonscript">Leaf Corcoran</a> just released v1.0, which got better Lua support and more extensive documentation.</p>

<p>Since Lapis runs inside OpenResty, I'll be using a very similar setup to what was used for <a href="http://notebook.kulchenko.com/zerobrane/debugging-openresty-nginx-lua-scripts-with-zerobrane-studio">OpenResty debugging</a> while following instructions on <a href="http://leafo.net/lapis/reference/lua_getting_started.html">Creating a Lapis Application with Lua</a> page.</p>

<h2>ZeroBrane Studio configuration.</h2>

<p>1. Get <a href="http://studio.zerobrane.com">ZeroBrane Studio</a> (0.70+). These instructions are for Windows, but the debugging should work on Linux and <span class="caps">OSX </span>as well.</p>

<p>2. Start <span class="caps">ZBS </span>(<code>zbstudio.exe</code> or <code>zbstudio.sh</code>) and start the debugger <code>Project | Start Debugger Server</code>.</p>

<h2>Lapis configuration.</h2>

<p>The easiest way to get Lapis and its dependencies is to use luarocks package manager and run <code>luarocks install lapis</code> command. You then need to make Lapis and its dependencies available to Nginx/OpenResty. If you don't have <code>luarocks</code> installed or prefer to do things manually, try the following:</p>

<p>1. Download <a href="http://leafo.net/lapis/">Lapis</a> and copy <code>lapis</code> folder inside of it to <code>&lt;NGINX&gt;/lua</code> folder.</p>

<p>2. Download <a href="https://github.com/kikito/ansicolors.lua">ansicolor.lua</a> and copy it into <code>&lt;NGINX&gt;/lua</code> folder.</p>

<p>3. Download and compile <code>lpeg</code> and <code>cjson</code> libraries and copy the resulting dynamic libraries to the same folder where you have <code>lua51</code> dynamic library (.dll, .so, or .dylib). If you are using Windows and get those libraries from LuaForWindows, LuaDist, or similar binary distribution, you may need to copy <code>&lt;ZBS&gt;/bin/lua5.1.dll</code> (not <code>lua51.dll</code>!) to the same folder where you copied the libraries (where <code>lua51.dll</code> file is located). This is necessary because those dll files are likely to be linked to <code>lua5.1.dll</code>, but OpenResty comes with <code>lua51.dll</code> and this <code>lua5.1.dll</code> acts as a proxy.</p>

<h2>OpenResty configuration.</h2>

<p>1. I'm using a very basic config (<code>&lt;NGINX&gt;/conf/nginx.conf</code>):</p>

<pre><code>worker_processes  1;
events {
    worker_connections  1024;
}
http {
    lua_package_path '&lt;ZBS&gt;/lualibs/?/?.lua;&lt;ZBS&gt;/lualibs/?.lua;;';
    lua_package_cpath '&lt;ZBS&gt;/bin/clibs/?.dll;;';
    server {
        location / {
            default_type 'text/html';
            content_by_lua_file 'lua/web.lua';
        }
    }
}</code></pre>

<p>Make sure you replace <code>&lt;ZBS&gt;</code> with the actual path to ZeroBrane Studio location. If you are running on <span class="caps">OSX, </span>replace <code>?.dll</code> with <code>?.dylib</code> and if you are running on Linux, replace <code>bin/clibs/?.dll</code> with either <code>bin/linux/x86/clibs/?.so</code> or <code>bin/linux/x64/clibs/?.so</code> depending on your platform.</p>

<p>2. Create the file we are going to debug (<code>&lt;NGINX&gt;/lua/web.lua</code>), which may look like this:</p>

<pre><code>local lapis = require(&quot;lapis&quot;)
require('mobdebug').start('192.168.1.22')
lapis.serve(require(&quot;my_app&quot;))
require('mobdebug').done()</code></pre>

<p>Note that <code>start()</code> call takes the IP of the computer running the <span class="caps">IDE.</span> It uses "localhost" by default, but since your nginx instance is running there, you will need to specify the IP address of the computer running the <span class="caps">IDE </span>(in my case it is <code>192.168.1.22</code>).</p>

<p>3. Create the application file as described in <a href="http://leafo.net/lapis/reference/lua_getting_started.html">Creating a Lapis Application with Lua</a> (<code>&lt;NGINX&gt;/lua/my_app.lua</code>):</p>

<pre><code>local lapis = require &quot;lapis&quot;
local app = lapis.Application()
app:get(&quot;/&quot;, function(self)
  return &quot;Hello world&quot;
end)
return app</code></pre>

<p>4. Open both files (<code>web.lua</code> and <code>my_app.lua</code>) in the <span class="caps">IDE </span>and set the project directory to <code>lua</code> folder by going to <code>Project | Project Directory | Set From Current File</code>.</p>

<p>If you already have a Lapis application you want to debug, you only need to update the Nginx config to include references to ZeroBrane Studio libraries and add <code>require('mobdebug').start(....)</code> and <code>require('mobdebug').done()</code> calls to <code>web.lua</code> file.</p>

<h2>Script debugging.</h2>

<p>Now start nginx and go to <a href="http://localhost/">http://localhost/</a>. If everything is done correctly, you should see ZeroBrane Studio activated with the green arrow pointing to the third line in the <code>web.lua</code> files. You can now set breakpoints, step through the code, look at the stack and so on.</p>

<p><img src="/images/zerobrane-studio-lapis-debugging.png" alt=""/></p>

<p>Using <code>step into</code> command (<code>Project | Step Into</code>) will allow you to step into <code>my_app.lua</code> file. If you want the application to stop in the handler that returns "Hello world", you can set a breakpoint on line 4 and then use "Run" command (<code>Project | Run</code>).</p>

<p>Note that the browser window will be showing "waiting for..." message until the execution of <code>web.lua</code> file is completed, at which point you should see "Hello world" text there.</p>

<h2>Debugging of Lapis files.</h2>

<p>In addition to debugging your own application, you may also step through Lapis files if you are interested. If you open one of Lapis files in the <span class="caps">IDE, </span>you will be able to set breakpoints and step through it. You may also configure the <span class="caps">IDE </span>to auto-open any Lua file the control gets into by setting <code>editor.autoactivate = true</code> in the configuration file.</p>]]>
        
    </content>
</entry>

<entry>
    <title>Debugging OpenResty and Nginx Lua scripts with ZeroBrane Studio</title>
    <link rel="alternate" type="text/html" href="https://notebook.kulchenko.com/zerobrane/debugging-openresty-nginx-lua-scripts-with-zerobrane-studio" />
    <id>tag:notebook.kulchenko.com,2014://2.183</id>

    <published>2014-05-13T04:22:05Z</published>
    <updated>2014-06-19T03:46:43Z</updated>

    <summary>ZeroBrane Studio has already been used to debug various Lua engines -- game frameworks (like Corona, Gideros, Moai, Love2d), home automation devices, wireshark scripts, Adobe Lightroom plugins, and more -- but there have been several Lua environments that I haven&apos;t...</summary>
    <author>
        <name>Paul Kulchenko</name>
        
    </author>
    
        <category term="zerobrane" scheme="http://www.sixapart.com/ns/types#category" />
    
    <category term="ide" label="ide" scheme="http://www.sixapart.com/ns/types#tag" />
    <category term="lua" label="lua" scheme="http://www.sixapart.com/ns/types#tag" />
    <category term="nginx" label="nginx" scheme="http://www.sixapart.com/ns/types#tag" />
    <category term="openresty" label="openresty" scheme="http://www.sixapart.com/ns/types#tag" />
    <category term="zerobrane" label="zerobrane" scheme="http://www.sixapart.com/ns/types#tag" />
    
    <content type="html" xml:lang="en" xml:base="https://notebook.kulchenko.com/">
        <![CDATA[<p><a href="http://studio.zerobrane.com">ZeroBrane Studio</a> has already been used to debug various Lua engines -- game frameworks (like <a href="http://notebook.kulchenko.com/zerobrane/debugging-and-live-coding-with-corona-sdk-applications-and-zerobrane-studio">Corona</a>, <a href="http://notebook.kulchenko.com/zerobrane/gideros-debugging-with-zerobrane-studio-ide">Gideros</a>, <a href="http://notebook.kulchenko.com/zerobrane/moai-debugging-with-zerobrane-studio">Moai</a>, <a href="http://notebook.kulchenko.com/zerobrane/love2d-debugging">Love2d</a>), <a href="http://notebook.kulchenko.com/zerobrane/debugging-on-vera-devices-with-zerobrane-studio">home automation devices</a>, <a href="http://notebook.kulchenko.com/zerobrane/debugging-wireshark-lua-scripts-with-zerobrane-studio">wireshark scripts</a>, <a href="http://notebook.kulchenko.com/zerobrane/debugging-lightroom-plugins-zerobrane-studio-ide">Adobe Lightroom plugins</a>, and more -- but there have been several Lua environments that I haven't tried it on. One of them is OpenResty/Nginx Lua scripts. <a href="http://openresty.org/">OpenResty</a> is a web application server built around nginx, a very fast web server, that provides non-blocking IO with various backends (Redis, Memcached, MySQL, <span class="caps">HTTP </span>servers, and others) and supports Lua as its scripting language.</p>

<p>I first tried to use the non-blocking socket <span class="caps">API </span>that OpenResty provides, but couldn't get the debugging to work because socket calls that were supposed to be blocking were returning too early, which was breaking the interaction between the debugger in the application and the <span class="caps">IDE.</span> Based on advice from Yichun Zhang (agentzh), the maintainer of the OpenResty bundle, I then tried to use the same luasocket library that ZeroBrane Studio is using and got it all working. These are the steps you can follow to try it yourself:</p>

<h2>ZeroBrane Studio configuration.</h2>

<p>1. Get <a href="http://studio.zerobrane.com">ZeroBrane Studio</a>. These instructions are for Windows, but the debugging should work on Linux and <span class="caps">OSX </span>as well.</p>

<p>2. Start <span class="caps">ZBS </span>(<code>zbstudio.exe</code> or <code>zbstudio.sh</code>) and start the debugger <code>Project | Start Debugger Server</code>.</p>

<h2>OpenResty configuration.</h2>

<p>1. I'm using a very basic config (<code>&lt;NGINX&gt;/conf/nginx.conf</code>):</p>

<pre><code>worker_processes  1;
events {
    worker_connections  1024;
}
http {
    lua_package_path '&lt;ZBS&gt;/lualibs/?/?.lua;&lt;ZBS&gt;/lualibs/?.lua;;';
    lua_package_cpath '&lt;ZBS&gt;/bin/clibs/?.dll;;';
    server {
        location /hellolua {
           default_type 'text/plain';
           content_by_lua_file 'lua/content.lua';
        }
    }
}</code></pre>

<p>Make sure you replace <code>&lt;ZBS&gt;</code> with the actual path to ZeroBrane Studio location. If you are running on <span class="caps">OSX, </span>replace <code>?.dll</code> with <code>?.dylib</code> and if you are running on Linux, replace <code>bin/clibs/?.dll</code> with either <code>bin/linux/x86/clibs/?.so</code> or <code>bin/linux/x64/clibs/?.so</code> depending on your platform.</p>

<p>2. Create the file we are going to debug (<code>&lt;NGINX&gt;/lua/content.lua</code>), which may look like this:</p>

<pre><code>require('mobdebug').start('192.168.1.22')
local name = ngx.var.arg_name or &quot;Anonymous&quot;
ngx.say(&quot;Hello, &quot;, name, &quot;!&quot;)
ngx.say(&quot;Done debugging.&quot;)
require('mobdebug').done()</code></pre>

<p>Note that <code>start()</code> call takes the IP of the computer running the <span class="caps">IDE.</span> It uses "localhost" by default, but since your nginx instance is running there, you will need to specify the IP address of the computer running the <span class="caps">IDE </span>(in my case it is <code>192.168.1.22</code>).</p>

<p>3. Open this file (<code>&lt;NGINX&gt;/lua/content.lua</code>) file in the <span class="caps">IDE </span>and set the project directory to <code>lua</code> folder by going to <code>Project | Project Directory | Set From Current File</code>.</p>

<h2>Script debugging.</h2>

<p><img src="/images/zerobrane-studio-openresty-nginx-debugging.png" alt=""/></p>

<p>Now start nginx and go to <a href="http://localhost/hellolua">http://localhost/hellolua</a>. If everything is right, you should see ZeroBrane Studio activated with the green arrow pointing to the second line (similar to what can be seen in the screenshot above). You can now set breakpoints, step through the code, look at the stack and so on.</p>

<p>You can also go to the remote console and run any ngx command there. For example, if you run <code>ngx.say(&quot;Message from console&quot;)</code> (as shown in the screenshot), you will see this text in the output after the script is done.</p>

<p>If you get "attempt to yield across C-call boundary" error in Nginx logs when you start debugging, try with a more recent ZeroBrane Studio (0.70+) as it includes several improvements that make debugging to work with recent versions of OpenResty.</p>]]>
        <![CDATA[<h2>OpenResty configuration for remote debugging.</h2>

<p>The following steps are only needed if you <b>configure OpenResty/Nginx for remote debugging</b> when Nginx runs on one machine and ZeroBrane Studio runs on another one. When you run both on the same machine, Nginx is using modules included with ZeroBrane Studio as those are referenced by <code>lua_package_path</code> and <code>lua_package_cpath</code> directives.</p>

<p>1. Copy the debugger (<code>mobdebug.lua</code>) and socket files. Go to <code>&lt;ZBS&gt;/lualibs/mobdebug/</code> and copy <code>mobdebug.lua</code> to <code>&lt;NGINX&gt;/lua/mobdebug.lua</code>; also copy <code>&lt;ZBS&gt;/lualibs/socket.lua</code> to <code>&lt;NGINX&gt;/lua/</code>. After all this is done, the content of <code>lua</code> folder is going to look like this:</p>

<pre><code>./
content.lua
mobdebug.lua
socket.lua</code></pre>

<p>2. Copy <code>&lt;ZBS&gt;/bin/clibs/socket/core.dll</code> to <code>&lt;NGINX&gt;/socket/core.dll</code> (<code>core.dylib</code> and <code>core.so</code> files are in the <code>bin</code> folder as well).</p>]]>
    </content>
</entry>

<entry>
    <title>Debugging Adobe Lightroom plugins with ZeroBrane Studio</title>
    <link rel="alternate" type="text/html" href="https://notebook.kulchenko.com/zerobrane/debugging-lightroom-plugins-zerobrane-studio-ide" />
    <id>tag:notebook.kulchenko.com,2014://2.182</id>

    <published>2014-04-07T04:35:20Z</published>
    <updated>2014-08-10T23:31:29Z</updated>

    <summary>(This post is by Christopher Reimold, who tested and documented the details of Adobe Lightroom plugin debugging.) Adobe Photoshop Lightroom is a photo management and editing program that offers the ability to extend its functionality through plugins written in Lua....</summary>
    <author>
        <name>Christopher Reimold</name>
        
    </author>
    
        <category term="zerobrane" scheme="http://www.sixapart.com/ns/types#category" />
    
    <category term="ide" label="ide" scheme="http://www.sixapart.com/ns/types#tag" />
    <category term="zerobrane" label="zerobrane" scheme="http://www.sixapart.com/ns/types#tag" />
    
    <content type="html" xml:lang="en" xml:base="https://notebook.kulchenko.com/">
        <![CDATA[<p>(This post is by Christopher Reimold, who tested and documented the details of Adobe Lightroom plugin debugging.)</p>

<p><a href="http://en.wikipedia.org/wiki/Adobe_Photoshop_Lightroom">Adobe Photoshop Lightroom</a> is a photo management and editing program that offers the ability to extend its functionality through <a href="http://www.adobe.com/devnet/photoshoplightroom.html">plugins written in Lua</a>. Debugging Lightroom plugin scripts has often been a somewhat cumbersome process, in which one had to resort to printing of variables to the console in order to understand what's going on in your plugin. However, there is now the possibility to use <b>full in-editor interactive debugging</b> which we will briefly demonstrate in this article.</p>

<h2>Minimally useful demo Lightroom plugin script</h2>

<p>We use the following short script to demonstrate developing and debugging of a Lightroom (LR) plugin in <a href="http://studio.zerobrane.com">ZeroBrane Studio Lua <span class="caps">IDE</span></a>. The plugin shows the <a href="http://www.dpreview.com/glossary/exposure/exposure">exposure value</a> to the user. To create a plugin for <span class="caps">LR, </span>you have to create at least two files and one directory:</p>

<p>(1) The <a href="/src/ExposureValue.lrplugin/Info.lua">Info.lua</a> file, which is a manifest that provides information about your plugin to <span class="caps">LR.</span> Its name is always <code>Info.lua</code>.</p>

<p><a href="/images/Lightroom-debugging-zbs-3.png"><img src="/images/Lightroom-debugging-zbs-3.png" alt="" height="100%" width="100%" /></a></p>

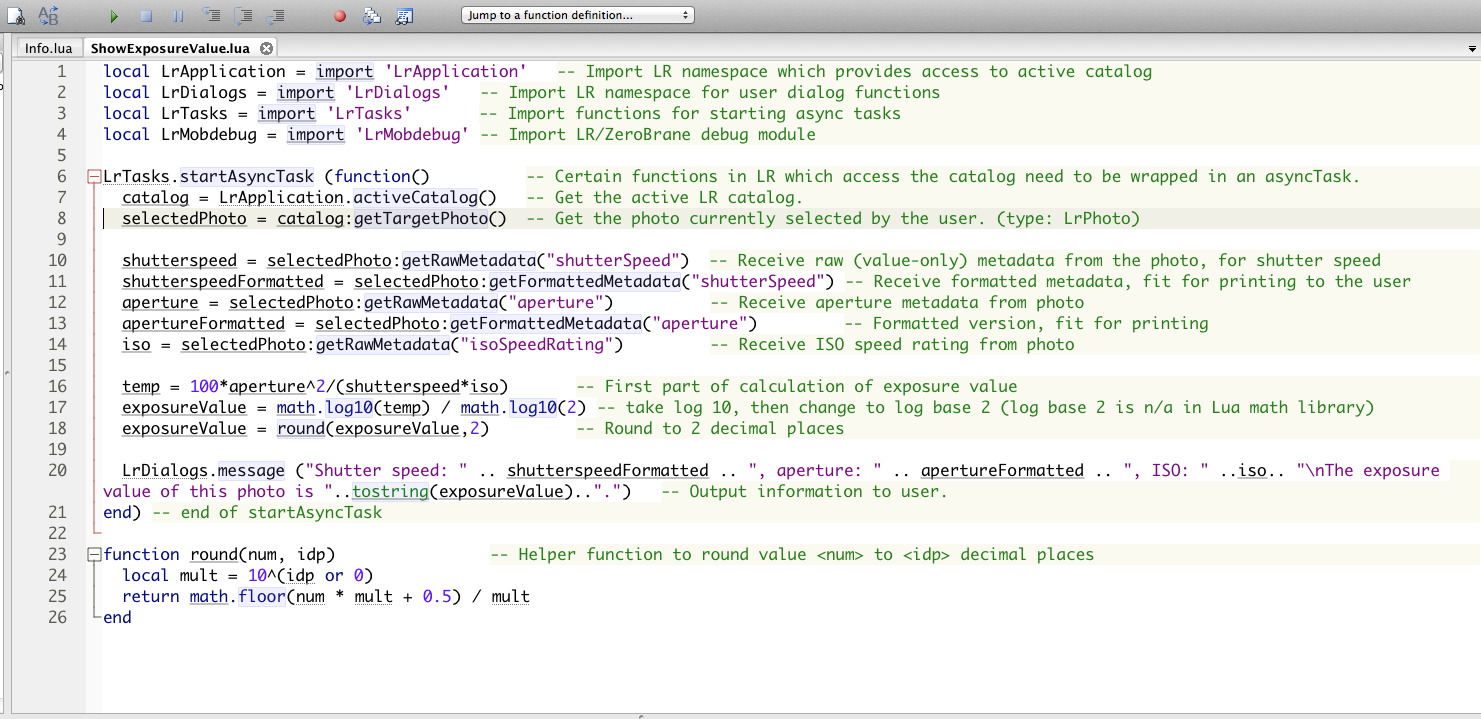
<p>(2) Your actual plugin, which is called <a href="/src/ExposureValue.lrplugin/ShowExposureValue.lua">ShowExposureValue.lua</a> in this example. It is referenced from your <code>Info.lua</code> file, as shown in the highlighted fragment above.</p>

<p><a href="/images/Lightroom-debugging-zbs-1.png"><img src="/images/Lightroom-debugging-zbs-1.png" alt="" height="100%" width="100%" /></a></p>

<p>Put these two files into a directory called <code>ExposureValue.lrplugin</code>; the directory can reside anywhere on your hard disk. The <code>.lrplugin</code> extension will make LR recognize this directory as a plugin. On <span class="caps">OSX, </span><code>.lrplugin</code> directories are recognized and treated as a package (single file). This can sometimes be problematic during development, and you can thus use <code>.lrdevplugin</code> as an extension on <span class="caps">OSX </span>if you want to avoid this. </p>

<p>If you want to learn more about developing an LR plugin, please have a look at the <a href="http://www.adobe.com/devnet/photoshoplightroom.html">Lightroom <span class="caps">SDK</span></a>, in particular the programmer's guide and the <span class="caps">API </span>reference.</p>]]>
        <![CDATA[<h2>Installing and running the plugin </h2>

<p>To make the plugin known to Lightroom, open <code>File | Plugin-Manager</code>. In the dialog, select <code>Add</code> and add your <code>.lrplugin</code> directory. The plugin should now show as <code>Display Exposure Value: Installed and running</code> in the left column. For development purposes, do check the <code>Reload plug-in on each export</code> option; this way you can be sure that the latest version of your script will be run. Close the dialog.</p>

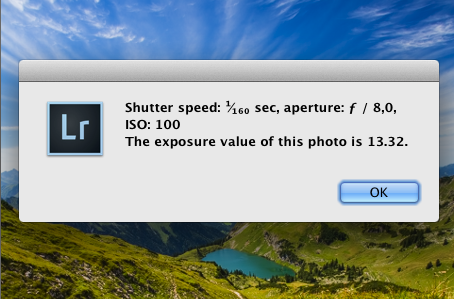
<p>If all has gone according to plan, you should now be able to find the plugin in the menu <code>File | Plug-in Extras | Show Exposure Value</code>. Start the plugin by selecting this menu item, and a dialog such as the following should appear:</p>

<p><a href="/images/Lightroom-debugging-zbs-4.png"><img src="/images/Lightroom-debugging-zbs-4.png" alt=""/></a></p>

<h2>Preparing your script for debugging</h2>

<p>In order to use ZeroBrane Studio (ZBS) as an interactive debugger, you now need to make some (minor) modifications to your script and environment so that the plugin and <span class="caps">ZBS </span>can communicate:</p>


<ul>
<li>Copy the files <a href="/src/mobdebug.lrmodule/Info.lua">Info.lua</a>, <a href="/src/mobdebug.lrmodule/LrMobdebug.lua">LrMobdebug.lua</a>, and <a href="https://raw.githubusercontent.com/pkulchenko/ZeroBraneStudio/master/lualibs/mobdebug/mobdebug.lua">mobdebug.lua</a> into the following directory: 
<ul>
<li>Mac: <code>~/Library/Application\ Support/Adobe/Lightroom/Modules/mobdebug.lrmodule</code> </li>
<li>Windows: <code>C:\Program Files\Adobe\Adobe Photoshop Lightroom 5.3\Modules\mobdebug.lrmodule</code></li>
</ul>
</li>
</ul>


<p>This module contains the LrMobdebug namespace which will enable LR to communicate with <span class="caps">ZBS.</span> This module is <strong>not</strong> a plugin and don't need to be installed/added as a plugin to <span class="caps">LR.</span></p>


<ul>
<li>Have a look at the file <code>mobdebug.lrmodule</code> you just installed. The version field in the Info.lua manifest there <b>has to match the major.minor version number of your Lightroom installation</b>, or the debugging will not work (as the module will not be loaded by Lightroom). So, if you're using LR 5.3, make sure you set major version in that file to 5 and minor to 3.</li>
</ul>


<h2>Changes to your script</h2>

<p>Now, add the following line somewhere near the beginning of your plugin: <code>local LrMobdebug = import 'LrMobdebug'</code>. Note: Import will throw an error if this module is not present, so if you are deploying your plugin on a customer's system, you'd need to comment out or remove all calls which refer to <code>LrMobdebug</code>.</p>

<p>Add <code>LrMobdebug.start()</code> call at the point where you would like the debugging to start. This will connect your script, running within the Lightroom environment, to the ZeroBrane debugger server and thus enable debugging from that execution point. (Note: <code>LrMobdebug.start()</code> will usually act like a breakpoint, i.e. execution will stop immediately after it; if you do not want this behavior, you can use the <code>debugger.runonstart = true</code> configuration setting in ZeroBrane Studio in order to avoid breaking at that point.)</p>

<p>Add <code>LrMobdebug.on()</code> after the beginning of any coroutine, i.e. <code>LrTasks.startAsyncTask(function() LrMobdebug.on() ...)</code>.  </p>

<h2>Interactive debugging with <span class="caps">ZBS</span></h2>

<p>Now, we're ready to start stepping interactively through our application. </p>


<ul>
<li>Open ZeroBrane Studio, go to <code>Project | Start Debugger Server</code> and start the debugger server (if this menu item is checked or disabled, the server is already started). When your script hits the <code>LrMobdebug.start()</code> command, this command will connect your script to the ZeroBrane debugger server. Therefore, the debugger server must be started before executing your plugin.</li>
<li>Make sure your plugin script is open in <span class="caps">ZBS.</span></li>
<li>Set the project directory to the directory of your plugin by going to <code>Project | Project Directory | Choose...</code> or using <code>Project | Project Directory | Set From Current File</code>.</li>
<li>Set a breakpoint in your script by clicking in the column directly to the right of the line numbers. A red circle signifies that you have successfully set a breakpoint. </li>
<li>Start your plugin in Lightroom, as described above. You should see a green arrow pointing to the next statement after the <code>start()</code> call in ZeroBrane Studio and should be able to step through the code.</li>
</ul>


<h2>Working with the debugger</h2>


<ul>
<li>Step through your program with the <code>Step Into</code> command, directly next to the Pause button. <code>Step Into</code> steps into functions, whereas <code>Step Over</code> steps over functions, as usual. </li>
<li>If you are interested in a variable, right-click it and <code>Add Watch Expression</code>. </li>
<li>The Stack Window shows the contents of the call stack.</li>
<li>You can rearrange windows to have the stack and watch window always in view, as shown in the screenshot below. </li>
<li>Select <code>Project | Continue</code> to continue execution of your script. It will stop at the next breakpoint, or run until termination if there is no next breakpoint.</li>
<li>If you want to interrupt your debugging activities for a while, you can simply stop the debugging or switch off the debugger server by unchecking <code>Project | Start Debugger Server</code> option (in <span class="caps">ZBS </span>v0.51+).</li>
</ul>


<p><a href="/images/Lightroom-debugging-zbs-2.png"><img src="/images/Lightroom-debugging-zbs-2.png" alt="" height="100%" width="100%" /></a></p>

<p><b>Many thanks to Dan Tull</b> who provided details on how the debugger can be called from Adobe Lightroom to get access to the required functionality.</p>]]>
    </content>
</entry>

<entry>
    <title>Corona on-device debugging with ZeroBrane Studio</title>
    <link rel="alternate" type="text/html" href="https://notebook.kulchenko.com/zerobrane/corona-on-device-debugging-with-zerobrane-studio" />
    <id>tag:notebook.kulchenko.com,2014://2.181</id>

    <published>2014-03-20T02:40:18Z</published>
    <updated>2014-03-20T03:06:34Z</updated>

    <summary>ZeroBrane Studio has supported Corona SDK debugging for over a year, but one of the less known features of the integration is that it supports on-device debugging in addition to debugging in the simulator. Since you can&apos;t initiate this process...</summary>
    <author>
        <name>Paul Kulchenko</name>
        
    </author>
    
        <category term="zerobrane" scheme="http://www.sixapart.com/ns/types#category" />
    
    <category term="corona" label="corona" scheme="http://www.sixapart.com/ns/types#tag" />
    <category term="ide" label="ide" scheme="http://www.sixapart.com/ns/types#tag" />
    <category term="zerobrane" label="zerobrane" scheme="http://www.sixapart.com/ns/types#tag" />
    
    <content type="html" xml:lang="en" xml:base="https://notebook.kulchenko.com/">
        <![CDATA[<p>ZeroBrane Studio has supported <a href="http://coronalabs.com/products/corona-sdk/">Corona <span class="caps">SDK</span></a> debugging for <a href="http://notebook.kulchenko.com/zerobrane/debugging-and-live-coding-with-corona-sdk-applications-and-zerobrane-studio">over a year</a>, but one of the less known features of the integration is that it supports <b>on-device debugging</b> in addition to debugging in the simulator.</p>

<p>Since you can't initiate this process from the <span class="caps">IDE, </span>it requires slightly different steps:</p>

<p>1. You need to include the debugger component (<code>mobdebug.lua</code>) with your application code (to allow <code>require 'mobdebug'</code> command to execute successfully). You can find it under <code>lualibs/mobdebug</code> in ZeroBrane Studio folder.</p>

<p>2. You need to include <code>require('mobdebug').start(&quot;IP-address-of-computer-running-ZBS&quot;)</code> in your code. Note that with "regular" debugging you simply include <code>require(&quot;mobdebug&quot;).start()</code>, but in this case you need to provide a domain name or an IP address of the computer with the <span class="caps">IDE </span>as this is where the debugger in the application will connect to.</p>

<p>3. You need to start debugger server in the <span class="caps">IDE </span>by going to <code>Project | Start Debugger Server</code>.</p>

<p>4. If you do debugging on Android devices, you may need to add <code>android.permission.INTERNET</code> permissions to the build settings, as documented <a href="http://docs.coronalabs.com/api/library/socket/index.html">here</a>.</p>

<p>If you open your Lua files in the <span class="caps">IDE </span>and you run your application on the device, you should see the message in the <span class="caps">IDE </span>that debugging has started. Most of debugging functions should work (stepping, breakpoints and the stack view), but any function that requires <code>loadstring</code> (remote console, watches, or value tooltips) won't work and will cause a run-time error in your application.</p>

<p>If you want to protect yourself from those run-time errors, you may run the following command in the local console <code>ide.debugger.options = {noshell = true, noeval = true}</code>; this will disable remote console and watches/tooltip evaluations to avoid using <code>loadstring</code> in the debugger. This configuration will be in effect for any debugging started remotely and will reset when you start any debugging from the <span class="caps">IDE </span>itself.</p>

<p>A better fix would be to allow Corona <span class="caps">SDK </span>to support <code>loadstring</code> during debugging; you may upvote this <a href="http://feedback.coronalabs.com/forums/188732-corona-sdk-feature-requests-feedback/suggestions/4502258-enable-lua-loadstring-for-debugging">feature request</a> that asks Corona to implement this.</p>]]>
        
    </content>
</entry>

<entry>
    <title>Gideros on-device debugging with ZeroBrane Studio</title>
    <link rel="alternate" type="text/html" href="https://notebook.kulchenko.com/zerobrane/gideros-on-device-debugging-with-zerobrane-studio" />
    <id>tag:notebook.kulchenko.com,2014://2.180</id>

    <published>2014-03-01T03:14:13Z</published>
    <updated>2014-03-20T02:28:42Z</updated>

    <summary>Keszegh Balazs, one of Gideros forum users put together a detailed overview of using ZeroBrane Studio for debugging of Gideros applications, including on-device debugging. Take a look at the tutorial if you have any questions about Gideros debugging with ZeroBrane...</summary>
    <author>
        <name>Paul Kulchenko</name>
        
    </author>
    
        <category term="zerobrane" scheme="http://www.sixapart.com/ns/types#category" />
    
    <category term="gideros" label="gideros" scheme="http://www.sixapart.com/ns/types#tag" />
    <category term="ide" label="ide" scheme="http://www.sixapart.com/ns/types#tag" />
    <category term="zerobrane" label="zerobrane" scheme="http://www.sixapart.com/ns/types#tag" />
    
    <content type="html" xml:lang="en" xml:base="https://notebook.kulchenko.com/">
        <![CDATA[<p>Keszegh Balazs, one of <a href="http://giderosmobile.com/forum/discussion/comment/34499">Gideros forum users</a> put together a <a href="http://www.indiedb.com/tutorials/gideros-with-zerobrane">detailed overview of using ZeroBrane Studio for debugging of Gideros applications</a>, including <b>on-device debugging</b>. Take a look at the tutorial if you have any questions about Gideros debugging with ZeroBrane Studio.</p>]]>
        
    </content>
</entry>

<entry>
    <title>Saving debugging output to a file</title>
    <link rel="alternate" type="text/html" href="https://notebook.kulchenko.com/zerobrane/saving-debugging-output-to-file" />
    <id>tag:notebook.kulchenko.com,2013://2.179</id>

    <published>2013-12-08T00:19:25Z</published>
    <updated>2013-12-08T01:09:05Z</updated>

    <summary>ZeroBrane Studio is often used for remote debugging, when the application being debugged is running on a different computer or a device, and it is very convenient to be able to &quot;redirect&quot; its printed output to the IDE. The IDE...</summary>
    <author>
        <name>Paul Kulchenko</name>
        
    </author>
    
        <category term="zerobrane" scheme="http://www.sixapart.com/ns/types#category" />
    
    <category term="ide" label="ide" scheme="http://www.sixapart.com/ns/types#tag" />
    <category term="lua" label="lua" scheme="http://www.sixapart.com/ns/types#tag" />
    <category term="plugin" label="plugin" scheme="http://www.sixapart.com/ns/types#tag" />
    <category term="zerobrane" label="zerobrane" scheme="http://www.sixapart.com/ns/types#tag" />
    
    <content type="html" xml:lang="en" xml:base="https://notebook.kulchenko.com/">
        <![CDATA[<p>ZeroBrane Studio is often used for <b>remote debugging</b>, when the application being debugged is running on a different computer or a device, and it is very convenient to be able to "redirect" its printed output to the <span class="caps">IDE.</span> The <span class="caps">IDE </span>supports this functionality and not only allows <b>"redirecting" of the printed output</b>, but also <b>pretty prints</b> the results such that <code>local t = {a = 1, b = 2} print(t)</code> will print <code>{a = 1, b = 2}</code>. This option is turned on by default for some interpreters and can be explicitly enabled using <a href="http://studio.zerobrane.com/doc-general-preferences.html#debugger">debugger.redirect</a> configuration option.</p>

<p>This is all good, but what if you have a long running process and want to be able to <b>use this "remote" printing as a log file</b>. The plugin below allows you to do just that: it will dump all the "remote" output to a file (<code>output.log</code> by default) in the current project folder. It also limits the number of records in the Output window (100 by default) to allow you to generate a large number of records without taking more memory.</p>]]>
        <![CDATA[<p>You can save the plugin to <code>packages/outputtofile.lua</code> and after restarting the <span class="caps">IDE </span>all the <b>remote output will be dumped to a local log file</b>.</p>

<pre><code>local filter, fname
local function append(fname, s)
  if not fname then return end
  local f = io.open(fname, &quot;a&quot;)
    or error((&quot;Can't open file '%s' for writing&quot;):format(fname))
  f:write(s)
  f:close()
end

return {
  name = &quot;Output to file&quot;,
  description = &quot;Redirects debugging output to a file.&quot;,
  author = &quot;Paul Kulchenko&quot;,
  version = 0.1,

  onRegister = function(self)
    local config = ide:GetConfig()
    local output = ide:GetOutput()
    local maxlines = self:GetConfig().maxlines or 100

    filter = config.debugger.outputfilter
    config.debugger.outputfilter = function(s)
      local start  = output:GetLineCount() - maxlines
      if start &gt;= 0 then -- trim the output to the right number of lines
        local readonly = output:GetReadOnly()
        output:SetReadOnly(false)
        output:SetTargetStart(0)
        output:SetTargetEnd(output:PositionFromLine(start+1))
        output:ReplaceTarget(&quot;&quot;)
        output:SetReadOnly(readonly)
      end
      append(fname, s)
      return s
    end
  end,

  onUnRegister = function(self)
    ide:GetConfig().debugger.outputfilter = filter
  end,
  onProjectLoad = function(self, project)
    fname = MergeFullPath(project, self:GetConfig().fname or &quot;output.log&quot;)
  end,
}</code></pre>]]>
    </content>
</entry>

<entry>
    <title>Lua package managers and integration with ZeroBrane Studio</title>
    <link rel="alternate" type="text/html" href="https://notebook.kulchenko.com/zerobrane/lua-package-managers-luadist-luarocks-and-integration-with-zerobrane-studio" />
    <id>tag:notebook.kulchenko.com,2013://2.178</id>

    <published>2013-12-04T01:18:12Z</published>
    <updated>2013-12-08T01:16:08Z</updated>

    <summary>Lua ecosystem has two package managers: LuaDist and LuaRocks. Both managers allow users to install Lua and C modules and work on Windows, Mac OS X and Linux, but have some important differences in how they operate, which I&apos;ll briefly...</summary>
    <author>
        <name>Paul Kulchenko</name>
        
    </author>
    
        <category term="zerobrane" scheme="http://www.sixapart.com/ns/types#category" />
    
    <category term="lua" label="lua" scheme="http://www.sixapart.com/ns/types#tag" />
    <category term="plugin" label="plugin" scheme="http://www.sixapart.com/ns/types#tag" />
    <category term="zerobrane" label="zerobrane" scheme="http://www.sixapart.com/ns/types#tag" />
    
    <content type="html" xml:lang="en" xml:base="https://notebook.kulchenko.com/">
        <![CDATA[<p>Lua ecosystem has two package managers: <a href="http://luadist.org/">LuaDist</a> and <a href="http://luarocks.org/">LuaRocks</a>. Both managers allow users to install Lua and C modules and work on Windows, Mac OS X and Linux, but have some important differences in how they operate, which I'll briefly go over.</p>

<p><b>LuaDist</b>:</p>


<ul>
<li>Unified build system for all modules based on CMake.</li>
<li>Mixed binary/source distribution that allows to use whatever dependency is available in the <a href="http://github.com/LuaDist">repository</a>.</li>
<li>Everything is stored in git (using github as host) including the <a href="http://github.com/LuaDist/Repository">repository manifest</a>. Tags are used for versions and branches for binary distributions.</li>
<li>Provides "batteries included" binary distributions (as a successor to Lua for Windows). </li>
<li>Relies on few Lua modules (luasocket, lfs, lua-git) for its implementation.</li>
<li>Allows for building the modules manually without using LuaDist.</li>
<li>Can be used from a command line or as a library (<code>local ld = require &quot;dist&quot;;  ld.install(&quot;luaexpat&quot;)</code>)</li>
<li>Uses dist.info files for package specification information (mostly for dependency tracking, no build information).</li>
<li>Provides support for packaging modules for distribution.</li>
<li>Includes about 260 projects (as of November 2013; based on the number of sub-modules in the repository).</li>
<li>Includes a good number of pre-compiled binaries for Windows, but many for outdated module versions.</li>
</ul>


<p><b>LuaRocks</b>:</p>


<ul>
<li>Supports local and remote repositories. </li>
<li>Distributed as a Lua scripts without dependencies, but relies on Unix tools for module deployment and installation.</li>
<li>Uses .rockspec files as a package specification file.</li>
<li>Uses "native" build instructions for each rock.</li>
<li>Includes rocks for 330 projects (as of November 2013).</li>
<li>Have several repositories: <a href="http://luarocks.org/repositories/rocks">main one</a> with manual curation and <a href="http://rocks.moonscript.org/">rocks.moonscript repository</a> that supports (non-curated) rock submission and download statistics.</li>
</ul>


<p>As we are talking about Lua module distribution, I'll also mention a nice project of Pierre Chapuis: <a href="https://lua-toolbox.com/">lua toolbox</a>. It provides a list of modules with short descriptions and their endorsement by various users (along with a simple tagging mechanism).</p>

<p>Both systems are easy to use as command-line tools. When you have one of the package managers installed, it's a matter of running <code>luarocks install module</code> or <code>luadist install module</code> commands to get the modules you need (assuming you have the tools available and don't run into compilation issues). It is certainly possible to setup LuaDist and LuaRocks to deploy modules to the directories you need and make those directories available to your project (see for example this nice write up by Thijs Schreijer on <a href="http://www.thijsschreijer.nl/blog/?p=772">Setting up Lua installation on Windows using Lua Rocks and ZeroBrane Studio</a>), but I'd prefer to have something simpler for users who may be new to programming and Lua. </p>

<p>I teach a semester long computer science class at a local high school during summer (using Lua and <a href="http://studio.zerobrane.com">ZeroBrane Studio</a>) and sometimes want to install Lua modules like <a href="http://stevedonovan.github.io/Penlight">penlight</a> to my students' computers and use them from ZeroBrane Studio. I have 18 students using their own laptops running different systems and want to be able to say "install penlight" and then make "require 'pl.strict'" to work in their Lua scripts. The coming version (v0.40) of ZeroBrane Studio (and the <a href="https://github.com/pkulchenko/ZeroBraneStudio">current master branch</a>) integrates with LuaDist and allows you to do just that.</p>]]>
        <![CDATA[<p>ZeroBrane Studio now includes LuaDist module dependencies and if you install <a href="https://github.com/pkulchenko/ZeroBraneStudio/issues/225#issuecomment-27532676">luadist plugin</a>, you will be able to <b>run LuaDist commands in the Local console of ZeroBrane Studio</b>:</p>

<pre><code>&gt; luadist.install('penlight')
Running 'install' for Lua 5.1 in '...\luadist\5.1'.
Downloading repository information...
Finding out available versions of penlight...
 - trying another candidate due to: Error when resolving dependencies: Error when retrieving the info about 'penlight': Error fetching package 'penlight-1.2.1' from 'git://github.com/LuaDist/penlight.git' to '...\luadist\5.1\tmp': Binary version of module not available and using source modules disabled.
Getting penlight-1.1 (binary)...
Finding out available versions of luafilesystem...
Getting luafilesystem-1.6.2 (binary)...
Finding out available versions of alien...
Getting alien-0.7.0 (binary)...
Finding out available versions of libffi...
Getting libffi-3.0.9 (binary)...
Installation successful.
Completed in 25 second(s).

&gt; require 'pl.strict'
{closed_module = function() --[[..skipped..]] end, make_all_strict = function() --[[..skipped..]] end, module = function() --[[..skipped..]] end} --[[table: 0x03e4b790]]</code></pre>

<p>You can then use penlight modules from the console or from your Lua scripts. Some of the other commands you may use:</p>


<ul>
<li><code>luadist.install('lpeg')</code> -- install lpeg <b>binary</b> version for Lua 5.1 on Windows/OSX (if available) and <b>source</b> version on Linux.</li>
<li><code>luadist.remove('lpeg')</code> -- remove lpeg module (for Lua 5.1)</li>
<li><code>luadist.install('lpeg', {source = true})</code> -- install lpeg source version (will likely get Lua as well)</li>
<li><code>luadist.install('lpeg', {source = true, debug = true})</code> -- include all cmake commands and verbose output</li>
<li><code>luadist.install('lpeg', {source = true, verbose = true})</code> -- include verbose output, but not cmake commands</li>
<li><code>luadist.install(5.2, 'lpeg', {source = true})</code> -- install lpeg source version for Lua 5.2 (will likely get Lua as well)</li>
<li><code>luadist.install('lua-5.1.3')</code> -- install specific Lua version; you may need to remove the current one first using <code>luadist.remove('lua-5.1.5')</code> command.</li>
</ul>


<p>You can also try other LuaDist commands <code>show</code>, <code>info</code>, <code>search</code>, <code>tree</code>, and so on. All commands that don't include Lua version will work with default Lua 5.1 interpreter and if you <b>include 5.2</b>, the commands will use 5.2 interpreter. Modules for Lua 5.1 and Lua 5.2 are installed into different folders, so you can use both interpreters without conflicts.</p>

<p>If you get an error during installation, try running the same command with <code>debug=true</code> option to see what the actual cmake error is.</p>

<p>What <b>works</b>:</p>


<ul>
<li>Windows binary installs (where available) and source installations using Lua 5.1 and Lua 5.2. Tested with cmake 2.8.10+ and <a href="http://tdm-gcc.tdragon.net/download">mingw-tdm</a>.</li>
<li><span class="caps">OSX </span>source installs using Lua 5.1 and Lua 5.2 (configured to build universal binaries); you'll need CMake 2.8.10+.</li>
<li>Linux source installs using Lua 5.1 and Lua 5.2 (both 32bit and 64bit)</li>
</ul>


<p>What <b>doesn't work</b>:</p>


<ul>
<li>Windows binary install using Lua 5.2 (this retrieves the same module as for Lua 5.1, which doesn't load)</li>
</ul>

]]>
    </content>
</entry>

</feed>