GSL Shell is an interesting project by Francesco Abbate that implements an interactive shell with access to a collection of mathematical methods for numerical computations in GNU Scientific Library (GSL). It's based on LuaJIT engine, which makes it very fast; it also includes extensive documentation with many examples.
One of ZeroBrane Studio users opened an issue asking about integration with GSL shell and I decided to take a look. After solving several problems with the help of GSL Shell author (Francesco Abbate) and enthusiastic users (coppolajj and Marcel van Herk), things started to work. Note that you need to download and install luasocket library compiled to work with GSL shell.
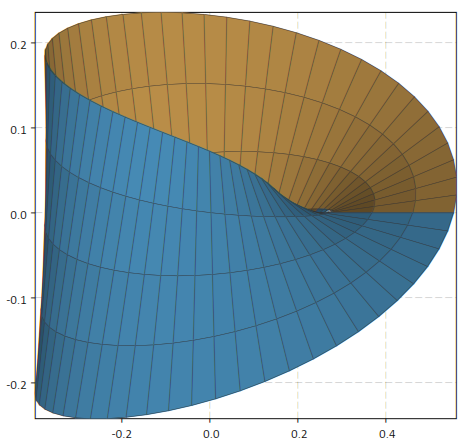
It is now possible and is (going to be) available in ZeroBrane Studio v0.34 to run and debug GSL shell scripts, like the one below, which plots the Moebius surface:
use 'math'
require 'plot3d'
x = |u,v| (1 + 1/2 * v *cos(u/2))*cos(u)
y = |u,v| (1 + 1/2 * v *cos(u/2))*sin(u)
z = |u,v| 1/2 * v * sin(u/2)

require('mobdebug').start()

graph.surfplot({x, y, z}, 0, -1, 2*pi, 1,
  {gridu= 60, gridv= 4, stroke= true})
There are several things that are interesting about this small example. First, you need to specify require('mobdebug').start() to start debugging (this is the same way you do it for Love2d, Gideros, and some other engines). You also need to select "GSL-shell" as the interpreter by going to Project | Lua Interpreter.
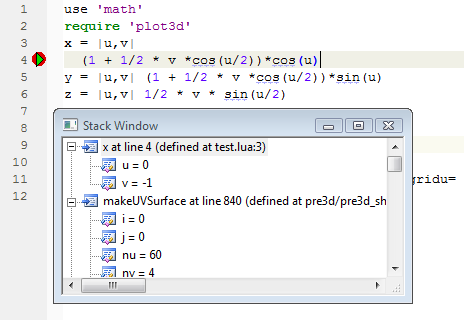
Second, one can debug functions x, y, and z, even though GSL shell provides an alternative non-standard (for Lua) syntax to define functions, which is used in this example. You can not only set breakpoints on lines where these functions are defined, but you can also split those one-line functions into multiple lines and step through them, inspect variables, modify them, and so on. This is possible because ZeroBrane Studio debugger (MobDebug) is using debugging facilities provided by Lua and GSL shell transforms this syntax into structures that LuaJIT can correctly report on.
Another things is that if you run this example with and without the debugger, you will notice a significant difference in performance: on my windows laptop it is executed in about 3s with the debugger, but in 20ms without it. As I described earlier, MobDebug provides a mechanism to turn debugging on and off in your script. For example, if you add require('mobdebug').off() after require('mobdebug').start(), then the script will execute in 20ms instead of 3s, but all the debugging functionality will be turned off (you wont be able to step through the code and breakpoints will not fire). You can add require('mobdebug').on() line to your script and all commands executed after this on() call is executed will be again available for debugging. This gives you a flexible mechanism to specify what fragments of your code need to run with debugging on and what fragments need to run at full speed.
This GSL shell integration is available in ZeroBrane Studio v0.34; you can also get the latest code from GitHub to give it a try.
I'm using ZeroBrane Studio to run GSL-Shell as an alternative to MATLAB. I love the livecoding option especially. Thank you very much!